Entering the potential danger zone
Week beginning February 20, 2012
We are now entering what is potentially the most dangerous 4-week period of the entire year.
Copyright: Randall Ashbourne - 2011-2012
Last weekend, I posed the question in the heading of whether the SP500 was to hit 1360 ... or decline to 1290 first. The question was answered at Friday's Open when the computers gapped Pollyanna up to Open at 1360.
There is now a strong chance of at least a 2nd degree countertrend down developing, followed by the last rally before the big Bear bites back.
Now, there are other possibilities. But, I don't want to get into the quibble-smarm-hedge stuff which leaves me a whole list of alternatives so I can come back in a week or two and selectively quote something from today to show what a smart-arse I am.
I'll tell you what I think is probable here. And tell you I was wrong about the pattern I thought would develop after the TAS (trading against a spike) Low in October. At the time of the August spike, we discussed the TAS pattern, which is not discussed in The Idiot & The Moon - and I gave my opinion of a sharp snapback rally, which would be followed by a long, confusing and complex B wave, and then a final exhaustion run to complete the pattern before the Bear returned big time.
It turns out the B wave was not confusing. It was simple. It is what I believe to be the final rally phase which is confusing, containing elements of both a slow grind and an exhaustion.
Those of you who have read my Forecast 2012 know that we are coming up on the first of the dates I predicted to be very significant in terms of major trend changes.
And for a whole host of technical and astrological reasons, Forecast 2012 predicts a probable long-term topping process to unfold within this period.
And for a whole host of technical and astrological reasons, Forecast 2012 predicts a probable long-term topping process to unfold within this period.


We will examine the elements of the still-unfolding rally wave in some detail this weekend. To me, it does not look as if it is complete. It appears to need one more corrective decline and a final rally, which may truncate, before this Bull run hits the wall.
Now, I may be entirely wrong! It is possible I am massively wrong and those optimistic Elliotticians who believe we're off to the land of hope and glory are correct.
I received an email this morning from a guy who might rightly be considered America's most famous financial astrologer. It's not a title I'd give him. Using every opportunity available to get your head on TV makes you famous - not necessarily right.
The email has lots of vivid red coloring and strident CAPITAL LETTERS and exclamation marks!
It's not from Ray Merriman, whom I regard as undoubtedly The Best financial astrologer alive. The person in question has a habit of hitting on a midpoint straight from Ebertin's book and using it to predict The End Of Civilisation As We Know It. And for the past couple of years he's been right about as often as Robert Prechter.
Still, I do agree we're now entering the most dangerous time of the year - and it is certainly possible from a Spooky Stuff perspective that this week's New Moon in Pisces, conjunct the now-at-home Neptune, could portend the final High mark for 2012. I launched into a waffle about les Spookies last weekend, so y'all can take a peek in the Archives 2012 library if you need a reminder about just how happy Neppy might be at the moment.
Actually, while I'm on the subject of potential New Moon high points, I received another email this morning - this one from a recent buyer of The Idiot - and it contains a piece of information some of you Loony traders might find interesting. JM has discovered a profitable tweak to the system which works with the SPY.
JM begins:
"I like the simplicity of the phases of the moon and I couldn't believe it could be so easy, so to prove it to myself I constructed a spread sheet starting with selling 1 share of SPY on Dec 30, 2005 and continuing with the pattern of selling 1 additional share on Q1, buying 3 shares on FM (to get long 1 share), buying 1 additional share share on Q3, selling 3 shares (to get short 1 share) on NM .... I entered the prices of the opens and the closes on my spread sheet to see if there might be a small advantage to trading the system on the opens.
To my amazement the system does work, but you knew this already. What I also found was that by entering trades at the opening prices you would have out performed the trades entered on the close of the day, except in 2006. From Dec 30, 2005 until Feb 7, 2012, trading 1 share of SPY, the system profited $207.78 using opening prices and $160.53 using closing prices. And in 2008, when the system trading the closes showed a small loss of -$6.50 per share and the opening prices showed a profit of $42.80 during the same time period."
In outlining the system in The Moods of The Moon chapter of the book, I used closing prices for clarity and simplicity. I could have "played" with the system I outlined to improve the final numbers. But that was not my point - which was to demonstrate that as a statistical tendency in certain conditions, Moon Trading can be very profitable.
You must remember the central tenet of the book is to simplify your trading life ... to avoid over-analysis and agonising and try to concentrate instead on angst-free methods which provide safe and reliable profits consistently. Nevertheless, JM's slight and easy variation on the theme may be of use to you, so I'm sure he won't mind my sharing it with you here.
And before we leave the topic of Moon Trading, I want to remind you that once The Idiot moves to Bearish conditions across the three timeframes, the NM-FM drops can be huge ... and you're likely to lose money betting on the long-range statistical tendency for markets to rise FM-NM.
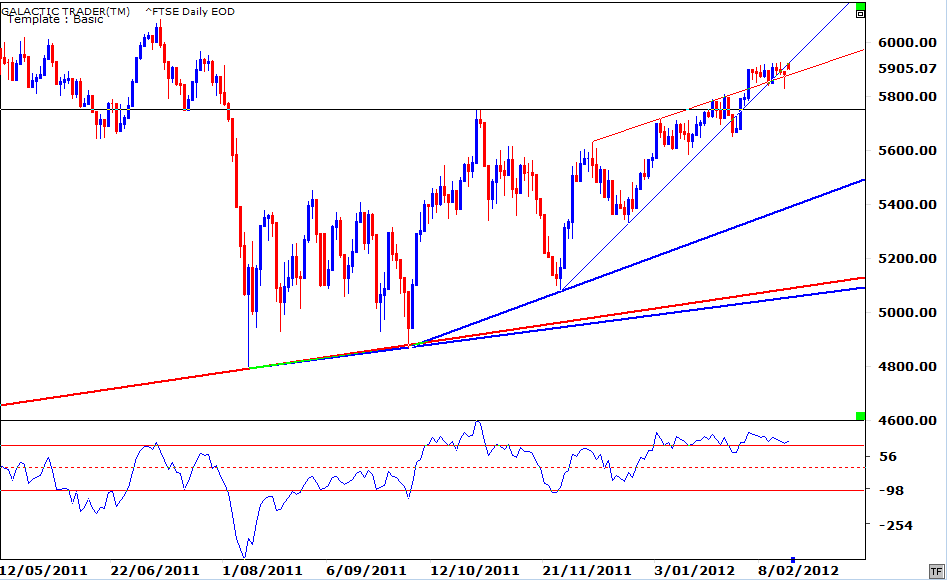
Still, we are NOT in Bearish conditions. Yet. And that's what we need to turn our attention to now. We're going to begin with London's FTSE - the index the New Jersey computers like to play games with in order to goose the Opening numbers on Wall Street.
It's not exactly a pretty picture. For the past two weeks, the FTSE has been locked down within a very narrow range. Is it accumulation ... or is it a churning form of distribution where the big boys are holding the index up so they can unload their holdings to gullible retail buyers?
We start with this chart because it points to an air of unreality about the new highs being reached on Wall Street and warns that Pollyanna may be preparing to exit stage left, as Chicken Little comes roaring back.
I need to stress that I may be utterly wrong about the Bearish outlook and certainly I am NOT yet seeing any unhealthy squawks from the longer-range Canaries. Nevertheless, the American optimism is not being confirmed by many other stock indices worldwide.
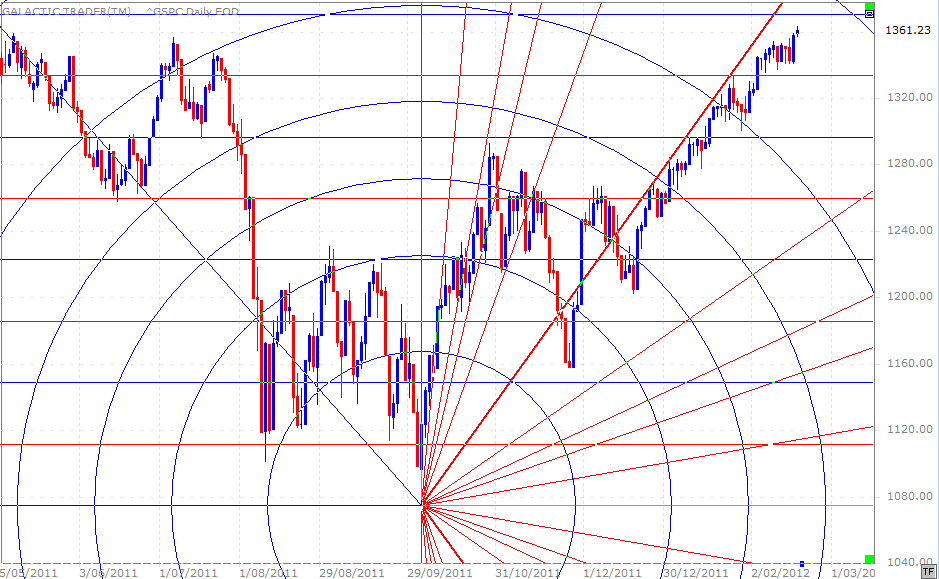
And when we take a closer look at Miss Pollyanna, we can see it was only at the end of the week the index managed to put in higher numbers.
Now, I indicated earlier in this edition that the "pattern" does not yet look complete to me. As y'know, I caution against getting too involved with Elliott Wave theory. The guru is Bob Prechter ... and if even he frequently misreads the sub-waves, the rest of us have no hope.
So, I tend to look at the overall theory from a KISS viewpoint. What it looks like from one step back, is often what it is. Now, this rally wave which started in December looks as if it needs a 2nd degree correction and then a final exhaustion before the pattern is complete. Under this scenario, the final rally does not actually need to exceed the current price, though a "false break" high wouldn't surprise me one iota. Maybe it's wishful thinking on my part, but that scenario also takes it into the early to mid March timeframe I've been talking about for so long and which is detailed in Forecast 2012.
So, I tend to look at the overall theory from a KISS viewpoint. What it looks like from one step back, is often what it is. Now, this rally wave which started in December looks as if it needs a 2nd degree correction and then a final exhaustion before the pattern is complete. Under this scenario, the final rally does not actually need to exceed the current price, though a "false break" high wouldn't surprise me one iota. Maybe it's wishful thinking on my part, but that scenario also takes it into the early to mid March timeframe I've been talking about for so long and which is detailed in Forecast 2012.
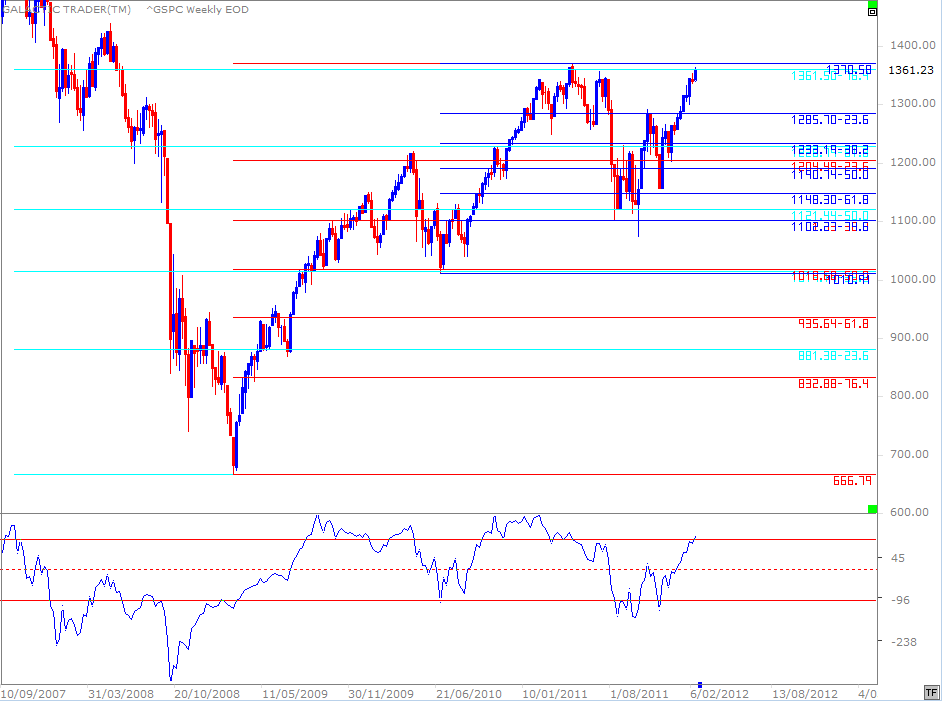
Last weekend, I showed this chart of various Fibonacci levels and remarked there was little doubt the geeks had programmed these into their computer trading programs. As is usual, the actual high on Friday overstepped the mark. To be blunt, I'm convinced the overshoots are arranged deliberately, to steal cash from smaller investors who put their Stops at the exact levels, rather than leaving themselves a little extra margin.
The only thing that concerns me, for the moment, is that the oscillator continues to confirm the rally. I want to emphasise this. You know I have the irritating habit of saying astrological expectations do NOT over-ride technical conditions. My expectation is that this Bull is now entering the danger zone. But! That expectation is NOT endorsed by current conditions. At least not yet.
The only thing that concerns me, for the moment, is that the oscillator continues to confirm the rally. I want to emphasise this. You know I have the irritating habit of saying astrological expectations do NOT over-ride technical conditions. My expectation is that this Bull is now entering the danger zone. But! That expectation is NOT endorsed by current conditions. At least not yet.
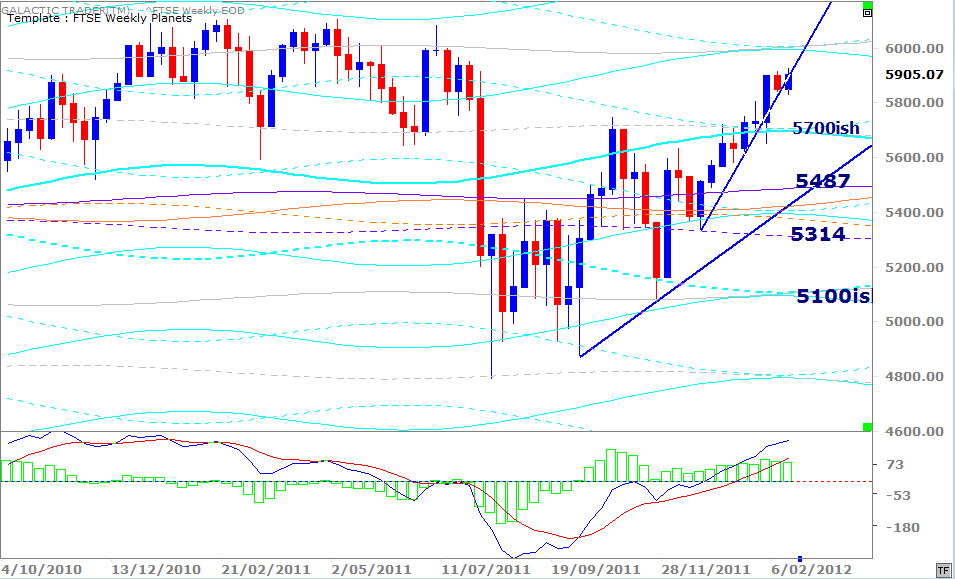
The Footsie's Weekly Planets chart, above, shows another attempt to stay in contact with the too far/too fast trendline. There is very mild divergence in the height of the MACD histogram readings, though not from the signal lines. If this index hits 6004 with any sort of significant divergence in the daily oscillators, I personally will be looking to increase a Short position on the FTSE.
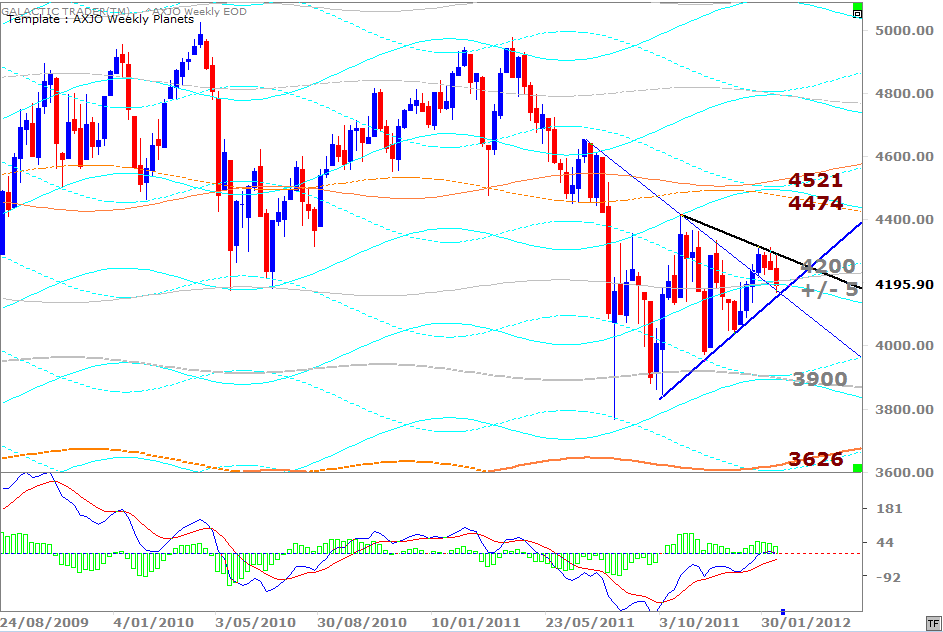
The ASX200 declined during the week, coming down for another test of the uptrend line - and the weekly planet price levels converging around the 4200 level. I've included another black overhead resistance line on the chart, which allows for a more prolonged symmetrical triangle pattern in play.
Usually, these are a continuation pattern - which means as the apex of the triangle is breached, Price continues in the same direction as it was heading before the triangle formed ... in this case, down. However, I caution again ... regardless of which way it resolves itself, breakout or breakdown, do NOT stand in front of it, crying it's "wrong"!
Usually, these are a continuation pattern - which means as the apex of the triangle is breached, Price continues in the same direction as it was heading before the triangle formed ... in this case, down. However, I caution again ... regardless of which way it resolves itself, breakout or breakdown, do NOT stand in front of it, crying it's "wrong"!
Safe trading - RA
(Disclaimer: This article is not advice or a recommendation to trade stocks; it is merely educational material.)
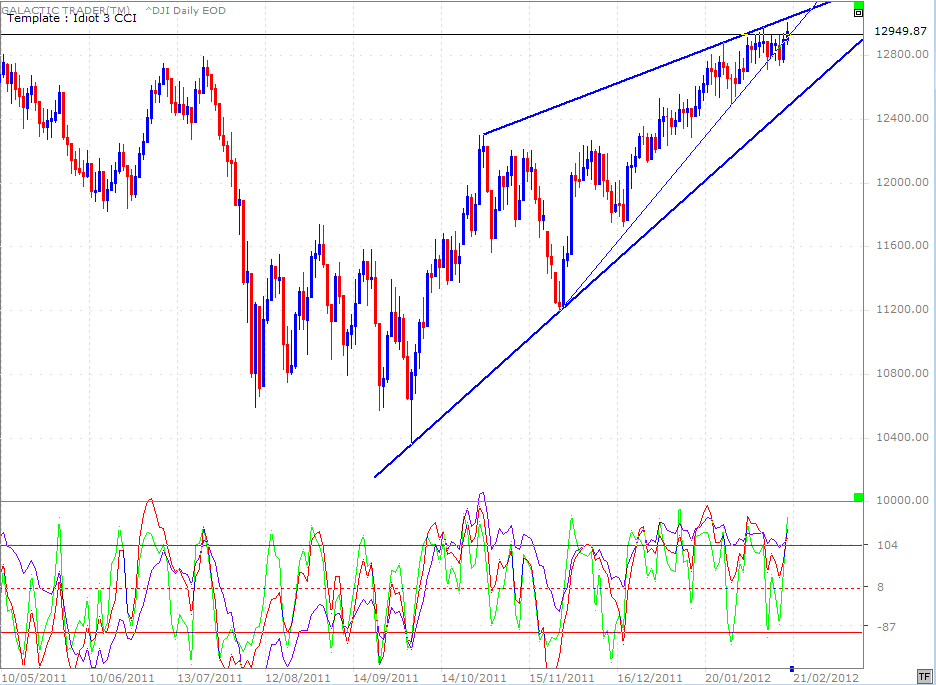
There is potential early confirmation of my expectation on the DJIA's daily chart, where the oscillators are beginning to show signs of ambivalence ... and where Price continues to be contained within what may yet be confirmed as a bearish wedge pattern.
Now, I've waffled on for long enough, so it's time to finish up - with the FTSE's Weekly Planets chart and some interesting charts for Auntie, the ASX200.
Now, I've waffled on for long enough, so it's time to finish up - with the FTSE's Weekly Planets chart and some interesting charts for Auntie, the ASX200.
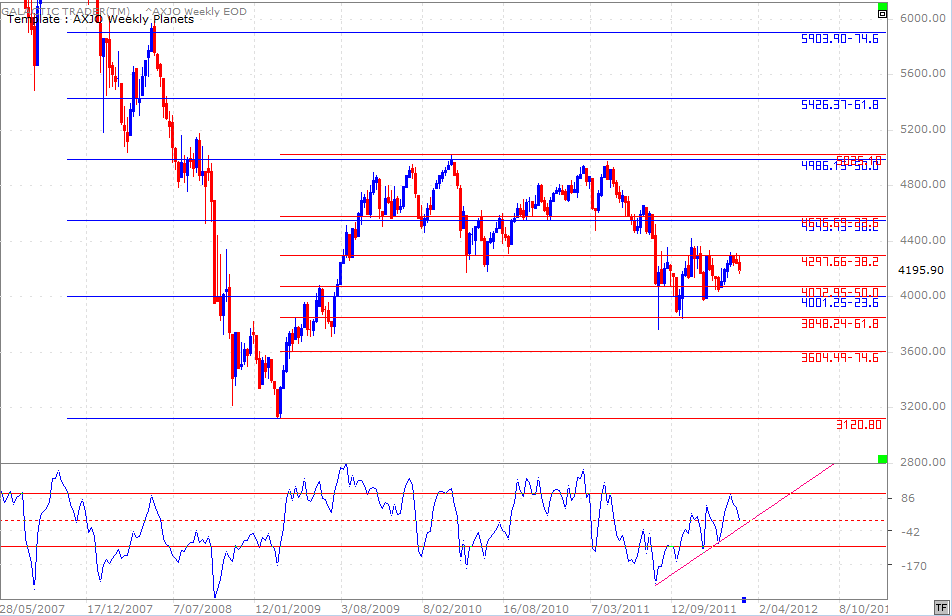
Last weekend I showed this as a sort of "cheat sheet" chart for Auntie while she was playing with the Fibolin's strings. It has been working very well for quite a few months, showing where to find the upside and downside turning points.
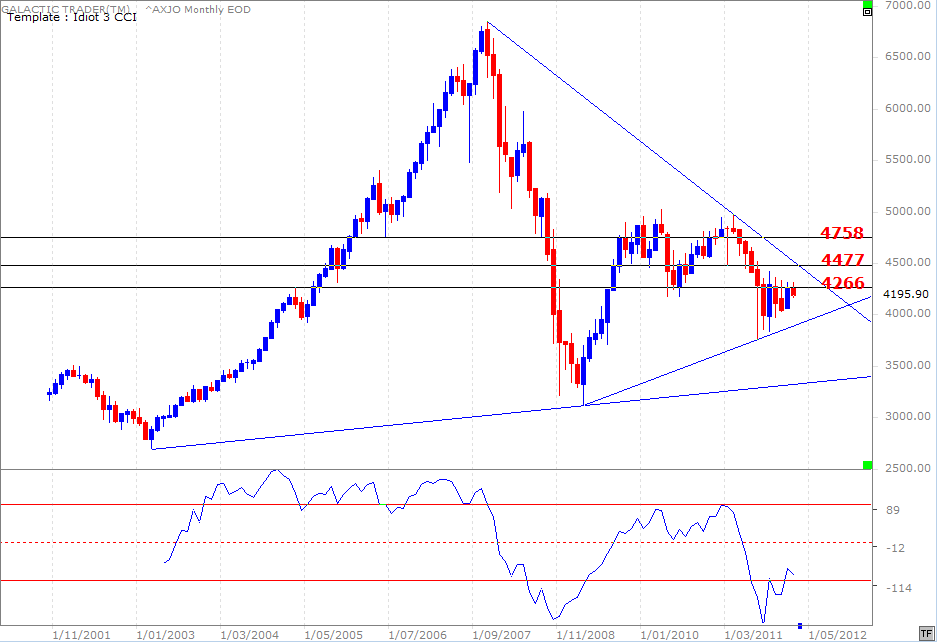
Just as a matter of interest, I'll show a big-range view of the same thing - though the Price levels are based purely on technical Support and Resistance levels, rather than planets or Fibs. Nevertheless, if you want to make sense of Auntie at a single glance, it may prove to be very useful. It's a monthly - obviously.
Just as a matter of interest, I'll show a big-range view of the same thing - though the Price levels are based purely on technical Support and Resistance levels, rather than planets or Fibs. Nevertheless, if you want to make sense of Auntie at a single glance, it may prove to be very useful. It's a monthly - obviously.
